I finally have a test that I don’t need to mastery! I actually understood the whole MRAM, RRAM, and LRAM thing. I mean don’t get me wrong I still hate it. I still don’t like estimating but at least I understand it. Now we’re doing u-substitution and I don’t really like it. It just seems like extra steps to me because I have a command to find anti-derivatives on my calculator. But I mean I have to do it so I guess I will. I don’t fully understand it yet because I hate it so I don’t want to understand it but I will. I’ll probably work on it with my dad when we have math night on Wednesday so then I should understand it. That’s really all we did this week. I don’t know what else to write about. I could keep telling you how much I hate this but I feel like that would be redundant and repetitive.
|
Okay so here’s the thing, I HATE estimations. I hate them so much. I’m really bad at estimating and I just don’t get the point. I want to know what the EXACT value of something is. This made me get very frustrated when we first started to learn about finding the area under a curve. I knew from the beginning how to do it on my calculator but we had to use approximation at the beginning. This was not a lot of fun for me. I knew how to use LRAM, RRAM, and MRAM but they still annoyed me. Once we were able to use our calculators to solve the problems I was much happier. I had to ask a few questions at the beginning but after that I was set. My only issue is that I have to have a picture of the graph in order to do the RAM stuff. It just doesn’t click in my head without a picture. After I sketch the graph I’m fine but I really hate sketching graphs and I hate estimation so this whole ordeal is really not that great for me. I like the way the command for this is set up on my calculator. It looks exactly like the problems that I’m given so it makes my life really easy.  This week we did optimization. It was pretty simple. I’ve discovered that drawing a diagram really helps but I would do that a lot anyway. Before we started discussing this topic, my dad and I talked about it a little. We talked about how this is used to fine the best dimensions for a soda can. I like this topic because it actually applies to the real world. I can actually see a reason to learn this and that makes me happy. Optimization is pretty easy. All you have to do is find a model for the situation (usually this is two equations) and then find the derivative of that. You have to solve one of the equations for a variable so that you can put that in the other equation so that you can find the derivative. That can be kind of annoying but it is usually pretty easy. After you find the derivative, all you have to do is find the zeros of that. Then you find the value of the other variable and boom, done. Sometimes you get two answers for the zeros but usually one makes absolutely no sense in the context of the problem. I mean I highly doubt that there’s going to be a box with a length of 0. That just wouldn’t happen. Anyway, yeah optimization makes sense to me so that’s nice.  It’s been a while but hey back to math now. This week we talked about lots of stuff. More derivatives mostly. I know, surprising right? We learned how to do curve sketching. It’s pretty easy so that’s good. People were complaining about not being able to use their calculators but I didn’t so I’m proud of myself. All you have to do for a curve sketch is find the max., min., zeros, asymptotes, where it’s increasing, where it’s decreasing, and concavity. That’s not that hard. For maximums, minimums, and zeros you just have to find critical points. To find where it’s increasing and decreasing, all you have to do is do the first derivative test. To do that all you have to do is find the first derivative (crazy right?) then you find the zeros of that and put them on a line thing. Then you test numbers on each side of those numbers on the number line. If those numbers give you a positive output, then it’s increasing. If it gives you a negative output then it’s decreasing. Concavity is the same way only you have to do the second derivative test. For that you find the second derivative (who would have guessed?) and do the same process as the first derivative test. If the outputs are positive then it’s concave up and if the outputs are negative then it’s concave down. Easy peasy. 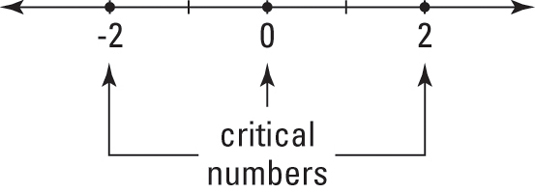 Week seven has been pretty okay. We talked about the chain rule. It’s probably the most annoying rule yet but it isn’t that bad. It kind of makes sense because it’s just taking the derivative of the outside while leaving the inside alone and then multiplying that by the derivative of the inside. It’s really annoying when you have to simplify that but we don’t usually have to do that so I guess it’s okay. It’s basically been expanding our knowledge about derivatives so we have the background knowledge which really helps. Sometimes I still struggle with finding the derivatives of things so that’s still not fully there. Sometimes I’ll get all the way to the end of a problem and then I’ll realize I messed up finding the derivative earlier on and then I just scream a little. It’s annoying because it always happens when I’ve actually simplified the problem and it’s just the worst. But yeah it’s pretty easy and painless so I’m not sure what else to say about it. 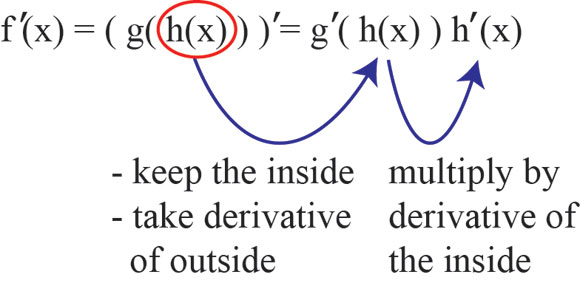 Week 6 is done and with that I’m ⅙ of the way done with this class. This week we talked more about the rules for finding derivatives. These rules made everything so much easier. Like couldn’t we have known about these sooner? No we had to do things the hard way first. I’m starting to feel like all math teacher like to torture us with complicated things when there are easier ways to do it. My dad does this too! Ugh, math teachers. Anyway the rules for derivatives are pretty nice. Other than the quotient one. That one kind of sucks but it’s still easier than having to use lim h->0 of f(x+h)-f(x)/h. That thing really sucks. I understood everything we did this week. It was pretty straight forward. The power rule is going to be in a picture down below because I don’t really feel like trying to write it out. It’s really easy though so that’s really nice. The product rule is f*g’+f’*g. Pretty easy. The quotient rule is (the derivative of the bottom times the top)-(the derivative of the top times the bottom)/the bottom squared. Not as easy but still not too bad. 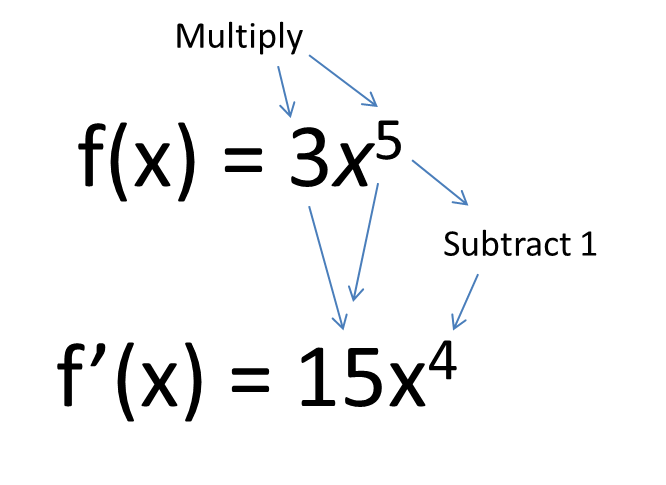 So it’s week 5 already. Only one more week until the end of the marking period. Only one more week until I’m ⅙ of the way done with this class. Yay! This week we talked about derivatives. They seem fairly simple. I mean they can be a lot of work with the 4 step process but oh well, at least it’s easy work. I thought it was kind of funny when Cresswell broke down the derivative equation thing into the four steps. At first I thought it would be some like big, crazy, helpful thing but nope. It was literally the equation broken up into its components. I still wrote it all down though. I started it so I had to finish it.
The 4 steps are:
The exercise at the beginning of the lab helped me see how a slope of a point is related to a function. This made making the GIFs a little bit easier. Having a basic knowledge of what was happening made it so that Kathryn and I were able to get the first GIF done with only a little bit (or a lot) of confusion and crying. Then came the second GIF. Oh how I hated the second GIF. After almost an entire period of messing with variables and punching the computer, I decided to google it. I decided that the best thing to google was “Connor Jones AP calc blog” and man was that a good idea. I could find his equations and as soon as I saw them I thought to myself “How did I not figure that out?” It made so much sense once I saw it. I probably couldn’t figure it out myself because I was tired and I had been working on the same thing for an hour. But now that I know what to do everything makes sense. Once I had that done, making my own GIF was pretty easy. I just followed the same basic steps and BAM! GIF. Secant lines are the average rate of change of a function. Tangent lines are the derivative of a function.
This week we learned about continuity. We also talked more about limits. Talking more about limits cemented it more in my mind. I do not really like talking about continuity when it comes to piecewise functions. Piecewise function annoy me in general and then looking at them closer is just even more annoying. The 3 steps that we use to figure out if something is continuous are actually fairly easy. I like having rules telling me what to do for something like this. It makes me hate math a little bit less. I am still having trouble with being able to look at a graph and being able to tell whether or not it is continuous. Like I feel like piecewise functions should not be continuous but they are. At least I think they are. Are they? Anyway they just confuse me. Also the thing with the graph with vertical asymptotes. Is that continuous? I thought it wasn’t but I think in class we said that it was because the asymptote wasn’t in the domain. So is that it then? Like if there is something that has an asymptote at x=0 so zero isn’t in the domain, it would still be continuous. But it wouldn’t be continuous on the interval [-1,1] because then zero would be in that set of numbers. I guess that makes sense. Okay then I think I’m pretty okay with this now. 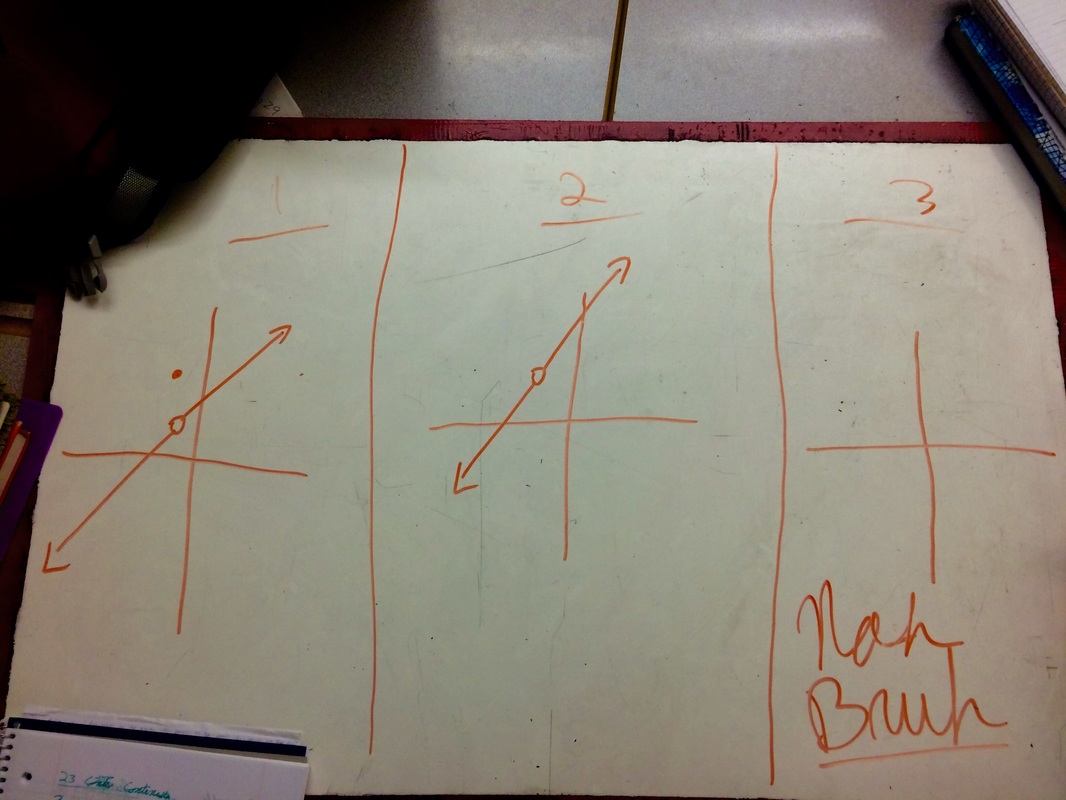 I have made it through my second week of calc and I have not died yet so things are looking pretty good. This week we learned about limits. Limits are the values that a function approaches as x approaches some number. There are different ways to find the limit of a function. The easiest way to find a limit (and my personal favorite because I am a lazy bum) is to use direct substitution. To do that I would just substitute the number that x is approaching for x. So basically if the thing is lim x->2 x2 -3x/x+3 then I would do 22-3*2/2+3 to get -⅖. So that means that lim x->2=-⅖. (I would have figured out the fancy way to write all of that out but it is 10:30 and I am tired so let’s just pretend that I did) Another way to find the limit of something would be to graph it. So I love my calculator and all but I really like Desmos for this. All I have to do is type in my function and then add a slider. Then it tells me the y values for whatever x values I put in using the slider. It is actually pretty nifty. I didn’t really understand this too well when we first started talking about it but now I get it. The video really helped so that was good. Now I understand how to do this so yay! Math!
|
Archives
February 2016
Categories |
 RSS Feed
